Bitcoin’s Subdued Start to the Week Amid US Market Closures
January 17, 2024 | by stockcoin.net

Bitcoin started the week off with a subdued tone as the US bond market, Nasdaq, and the New York Stock Exchange remained closed for Martin Luther King Jr. Day. With a slight decrease of 0.3% over the past 24 hours, bitcoin traded between $42,530 and $42,765 per unit, showcasing minor fluctuations within the range. Bitcoin’s daily chart reveals a distinct upward trend since late November, with periodic retracements that indicate a positive market sentiment. Oscillators present a predominantly neutral outlook, suggesting a state of equilibrium between buyers and sellers. However, the 4-hour chart signals increased variability and complexity in the short-term pricing trajectory, highlighting potential volatility and uncertainty. The mixed signals from moving averages further contribute to the nuanced investor sentiment in the market. While the overall trend leans towards further bullish activity, the complexities and fluctuations in the shorter timeframe indicate a potential downturn.


Bitcoin’s Subdued Start to the Week Amid US Market Closures
Monday is expected to be a relatively subdued day for Bitcoin trading activities due to the observance of Martin Luther King Jr. Day, which results in the closure of the U.S. bond market, Nasdaq, and the New York Stock Exchange (NYSE). Bitcoin has experienced a slight decrease of 0.3% over the 24-hour timeframe, trading within the range of $42,530 and $42,765 per unit. Throughout the day, Bitcoin’s intraday prices have fluctuated, reaching values from $41,746 to $43,005.

Bitcoin
Review of Bitcoin’s Daily Chart A review of Bitcoin’s daily chart reveals a distinct upward trend that has been ongoing since late November. This trend is characterized by a sequence of increasing peaks and troughs, indicating periods of substantial surges followed by minor declines. The presence of strong trading volumes on days with significant price fluctuations reinforces the authenticity of these price changes and suggests a positive market sentiment.
Oscillators and Market Balance Currently, the oscillators display a predominantly neutral outlook. The relative strength index (RSI) stands at 51, and the Stochastic is at 65, indicating that the market is neither overbought nor oversold. The commodity channel index (CCI) is situated at -71, which suggests a neutral zone. These collective indicators reflect a market in balance, showing no significant leanings towards excessive bullish or bearish conditions. This equilibrium between buyers and sellers contributes to a stable market state.
Bitcoin Technical Analysis
Bitcoin’s Daily Chart Bitcoin’s daily chart reveals a distinct upward trend characterized by a sequence of increasing peaks and troughs since late November. This pattern includes periodic retracements, with substantial surges followed by minor declines. The presence of strong trading volumes on days with significant price fluctuations reinforces the authenticity of these price changes and suggests a prevailing positive market sentiment.
Bitcoin’s 4-hour Chart Analyzing Bitcoin’s 4-hour chart provides a more detailed perspective, uncovering increased variability within the overarching upward trend. This shorter timespan reveals less distinct trends, characterized by more lateral movements, which hints at short-term complexity in the pricing trajectory. Notably, a decline from $49K to $41.5K around January 11-12, 2024, indicates increased selling activity or profit-taking.
Selling Activity and Profit-taking The recent decline in Bitcoin’s price highlights a significant increase in selling activity or profit-taking. This observation is pivotal for traders focusing on shorter durations, as it suggests potential market fluctuations and volatility.
Moving Averages and Mixed Signals Moving averages (MAs) across various periods present a more complex picture. The exponential moving averages (EMAs) for 10, 20, 30, 50, 100, and 200 days show a mix of bearish and bullish signals. Likewise, simple moving averages (SMAs) for the same periods mirror this mixed sentiment. The divergence between EMAs and SMAs, particularly in the 10 and 100-day periods, highlights nuanced investor sentiment and potential shifts in market momentum.

Bull Verdict
Bullish Signals on Daily Chart The prevailing bullish signals on Bitcoin’s daily chart, characterized by consistent higher highs and higher lows, suggest a strong upward momentum. These signals indicate a positive market sentiment and potential for continued bullish activity.
Balanced Market with Bullish Leanings While oscillators and moving averages indicate a balanced market, the overall trend leans towards further bullish activity. The resilience shown at established support levels, coupled with substantial trading volume, reinforces the potential for sustained upward movement.
Bear Verdict
Complexities and Fluctuations in 4-hour Timeframe Despite the overall bullish trend observed in Bitcoin’s daily chart, the complexities and fluctuations noted in the shorter 4-hour timeframe suggest potential volatility and uncertainty. These fluctuations may indicate a level of market unpredictability.
Neutral Oscillators and Mixed Moving Averages The neutral stance of oscillators such as the RSI and CCI, coupled with mixed signals from both EMAs and SMAs, further accentuates the uncertainty in the market. This combination of factors suggests that the market may be poised for a downturn.
Potential for Market Downturn Considering these factors, there is a possibility of a market downturn, and traders should remain cautious and closely monitor market conditions.
In conclusion, Bitcoin’s start to the week has been relatively subdued due to the closures of the U.S. bond market, Nasdaq, and the NYSE. Bitcoin’s daily chart shows a distinct upward trend with strong trading volumes, indicative of a positive market sentiment. However, the 4-hour chart reveals increased variability and complexities, suggesting potential volatility in the shorter term. Oscillators and moving averages present mixed signals, reflecting a market in balance but with leaning towards further bullish activity. Traders should carefully assess the market conditions and exercise caution in their trading strategies.

RELATED POSTS
View all

The Growth of Bitcoin Layer-2 Ecosystem and the Role of Lightning Network
January 22, 2024 | by stockcoin.net

Looking Beyond the ‘Magnificent Seven’ Tech Stocks of 2023: A Closer Look at Companies Providing Tech-Related Information Services
December 21, 2023 | by stockcoin.net
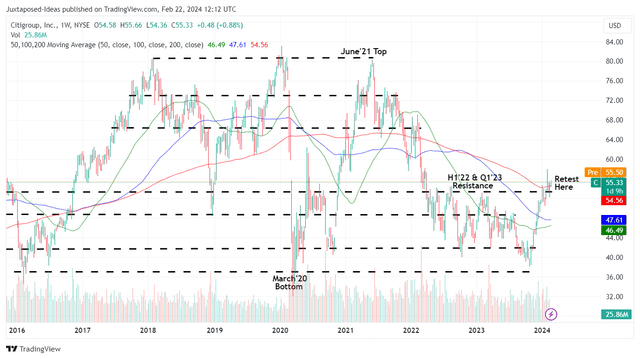
Citigroup Inc. implements cost optimization plans through 2026, leading to a turnaround in stock
February 25, 2024 | by stockcoin.net